

Come promesso a Massimo Bassini apro una nuova discussione sulle interazioni clima sole.
Il polacco, dice che c' correlazione tra sole enso e el nino, in particolare nel 1998, successe altre volte ma il caldo fu mascherato da eruzioni vulcaniche, raffreddanti coincidenti.
Ve la propongo solo come spunto per una discussione, non un idea precisa sul fenomeno (preferisco leggerne che scriverne, anche per evitare figure)
http://www.mitosyfraudes.org/Ingles/Warm.html
peer review: lo so che la rivista e l'autore non sono tra i più autorevoli risparmiatemi le critiche!
The Influence of the Sun
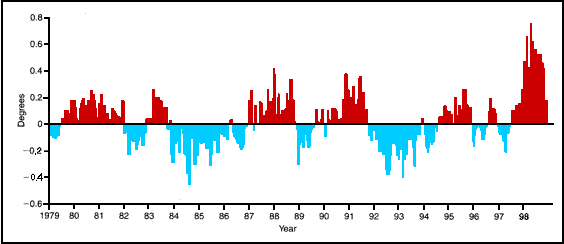
Recent studies by several groups of oceanographers, meteorologists, and astrophysicists show excellent agreement between the fluctuations of sea-surface temperature and the activity of the Sun. During the past 50 years, tropical and subtropical parts of three oceans have been cooling and warming by about 0.1°C, exactly in step with the 11-year solar cycle. This is asto-nishing, because differences in solar brightness reach only O.1 percent, not enough to cause the observed temperature changes. It seems that the solar signal triggers a climate effect by some amplifying mechanism. During the Little Ice Age, 300 years ago, solar radiation was only 0.25 percent lower than it is now.48 Since 1750, air temperature over the Northern Hemis-phere has been changing almost exactly in the rhythm of magnetic solar cycles, but not in the rhythm of greenhouse gas changes: When the Sun was more active, the Earth’s troposphere was warmer (Figure 7).47, 49, 51
The mechanism that amplifies the solar signal is probably a phenomenon like El Niño/Southern Oscillation (ENSO), that is, thermal anomalies of the east equatorial Pacific waters: El Niño, warming, and La Niña, cooling. ENSO anomalies occur as irregular 2- to 7-year cycles, asso-ciated with large-scale changes of atmospheric pressure in the tropics, between the southeas-tern and western Pacific. ENSO influences the climate of the whole planet.52 Satellite measure-ments suggest that during the observation period of the last 20 years, El Niño of 1998 caused the strongest thermal anomaly in the Earth’s atmosphere. In April and May 1998, the deviation of the global temperature from the 1982-199l average reached +0.7°C.
During the past 20 years, El Niño has occurred several times, but in ]997-1998, it developed without simultaneous volcanic eruption. Twice earlier, El Niño was associated with large volcanic eruptions, which injected enormous amounts of dust into the stratosphere: El Chichon in 1982, and Mt. Pinatubo in 1991. These eruptions caused a cooling of the global atmosphere, which masked El Niño’s thermal effects (Figure 6). It seems that ENSO is probably the strongest factor of natural variability of the global climatic system. Negative and positive anomalies of the global temperature associated with ENSO have been observed since 1958,54 and some were even observed as far back as 1610.52
Figure 6: SATELLITE TEMPERATURE MEASUREMENTS IN THE LOWER STRATOSPHERE
Numerous observations suggest that the ENSO phenomenon depends on the activity of Sun: Great solar explosions cause dramatic increases of the solar wind, and de-crease the intensity of cosmic radiation reaching the Earth’s atmosphere. Because cosmic rays provide condensation centers for clouds, great solar explosions probably enable the formation of El Niño, through a short-term, 2-to 3-percent decrease of the global cloud coverage.
Sempre sulle influenze delle eruzioni accennate dal polacco c'è anche questo post di Max Pagano
http://www.climatemonitor.it/?p=84
Ultima modifica di clayco; 17/12/2008 alle 17:42
Su Nino, soprattutto quello tosto del 97/98 ho messo un post sul Blog di MTG, e' in relazione con l'accellerazione artica: http://globalwarming.blog.meteogiorn...hiacci-artici/
Ma ovviamente la materia non finisce li.
Qui ad esempio le anomalie del NH extratropicale e quello tropicale. Si nota un "sospetto" climate step + o meno lungo dopo i Nino forti nel NH extratropici. Sui tropici l'assorbimento e' immediato con la Nina successiva.
tr-rss-extr.JPG
Questo l'andamento delle differenze, che risulta a media decadale nulla prima del Nino 98, di ben +0,23° dopo
tr-rss-extr-diff.JPG
Rispondo in ordine.Originariamente Scritto da Sandro58

Bell'articolo, ipotizzo che se esiste un'infuenza solare, (imporatnte più che sulla radiazione incidente sulle variazione di flusso magnetico) nell'oceano pacifico, su enso e el nino, è presumibile che ci sia anche sull'atlantico.
Grazie Sandro della discussione
Sempre su cicli solari e T° marine
http://www.agu.org/pubs/crossref/1991/90JD02774.shtml peer review
The record of globally averaged sea surface temperature (SST) over the past 130 years shows a highly significant correlation with the envelope of the 11-year cycle of solar activity over the same period. This correlation could be explained by a variation in the sun’s total irradiance (the solar ‘‘constant’’) that is in phase with the solar-cycle envelope, supporting and updating an earlier conclusion by Eddy (1976) that such variations could have played a major role in climate change over the past millennium. Measurements of the total irradiance from spacecraft, rockets, and balloons over the past 25 years have provided evidence of long-term variations and have been used to develop a simple linear relationship between irradiance and the envelope of the sunspot cycle. This relationship has been used to force a one-dimensional model of the thermal structure of the ocean (Hoffert et al., 1980), consisting of a 100-m mixed layer coupled to a deep ocean and including a thermohaline circulation. The model was started in the mid-seventeenth century, at the time of the Maunder Minimum of solar activity, and mixed-layer temperatures were calculated at 6-month intervals up to the present. The total range of irradiance values during the period was about 1%, and the total range of SST was about 1 °C. Cool periods, when temperatures were about 0.5 °C below present-day values, were found in the early decades of both the nineteenth and twentieth centuries. There is direct evidence for the latter period from the historical SST record and some indirect evidence for the earlier cool period. While many aspects of the study are unavoidably simplistic, the results can be taken as indicating that solar variability has been an important contributor to global climate variations in recent decades. It has probably not been the only contributor, however, and in particular, the growing atmospheric burden of greenhouse gases may well have played an important role in the immediate past. This role is likely to become even more important in the near future
Il secondo studio postato è un po' vecchiotto (1991), pur se giunge a conclusioni interessanti e ancora abbastanza attuali, IMHO.
Non può (per ovvia datazione) ancora tener conto di tutto quel che nel frattempo si è aggiunto, nell'ardua comprensione di un fenomeno tanto complesso quale è il sistema climatico.
Fra l'altro non tiene conto del fatto che le più recenti ricostruzioni della TSI (Leif Svalgaard) ridimensionano parecchio il ruolo delle sunspots, in particolare sembrerebbero essere parecchio sottostimate più si va indietro nel tempo (a partire grossomodo da metà del XX secolo).
Il primo, invece, mischia sapientemente (!) osservazioni corrette, altre triviali (nulla di nuovo) e altre ancora completamente sballate. FRra quest'ultime, per es. il fatto che nel 1997/98 si sia verificata l'eruzione del Pinatubo, in realtà datata giugno 1991.
Fra le triviali, il fatto che la troposfera tropicale sia la zona più sensibile al forcing interannuale indotto dall'ENSO. E per quanto riguarda le SST è ben noto l'"effetto fotocopia" causato a gran parte degli oceani tropicali e subtropicali (ma non sempre nell'Indo-Pacific Warm Pool, ovvio!).
Poi la questione dei GHG: mi pare evidente che non si possa cercare una risposta lineare nella relazione incremento dei GHG - incremento termico. Va letta sul trend di fondo, credo di averlo già scritto forse settantaquattro volte.
Infine, e di nuovo: le più recenti ricostruzioni dell TSI solare ne ridimensionano assai sia il trend di fondo sia il flusso magnetico.
Teniamo poi presente che la relazione ciclo solare undecennale - SST oceancihe non è così semplice come sembrerebbe. Per es. è noto che un maggior flusso solare (massimo del ciclo) tende ad indurre raffreddamento idrodinamico/radiativo del pacifico centro-orientale, in una situazione simil-Nina (Meehl et al. 2008).
Il sistema accoppiato oceano-atmosfera tende a reagire su scala interannuale/decadale in risposta a forcing sia radiativi (cambiamenti nel flusso discendente di radiazione a lunghezza d'onda corta/bassa entropia e di radiazione a lunghezza d'onda lunga/più alta entropia) sia stocastici.
~~~ Always looking at the sky~~~
Sunspot.
Con media corrente ogni 11 anni (1 ciclo), 33 anni e 110 anni.
Come la si mette la si mette ma l'attivita' solare ha menato molto + che nel passato.
IPCC computa la TSI media, ma il numero e entita' delle esplosioni magnetiche solari credo proprio che non possa in alcun modo essere trascurato.
Il Sole E' la fonte di energia e Vita del pianeta.
sunspot.JPG
Questa la media 50ennale del numero di sunspot. No comment.
sunspot-50.JPG
Possiamo anche vederla così.
Ricostruzione più recente della TSI: quella rossa, di Leif Svalgaard.
~~~ Always looking at the sky~~~
Un po di articoli recenti, qualcuno del 2009, magari possono servire per questa nuova discussione specialmente per il fenomeno specifico sunspot.
Per altri la dimensione è troppo grossa per inserirli in questa sede.
365509075.pdf
08111812402210136.pdf
08111812404410164.pdf
08111812410410177.pdf
08111812411710189.pdf
Salut
Vinc
jonioblu
Il link hostato su Svalgaard cioè questo
http://www.leif.org/research/
apre un dedalo di link nel quale non mi oriento
mi interessa in particolare la pubblicazione dalla quale è tratta il grafico in allegato, perchè in pratica annulla l'influenza delle macchie solari, apparentemente tutti i cicli ricostruiti da Svalgaard linea rossa sono +- uguali.
Ma Svenmark e Chistensen nel cercare l'influenza delle variazioni solari nel passato hanno trovato una grande variabilità tra i cicli attraverso lo studio dell'isotopo del Berilio Be10, che penso dipenda dai raggi cosmici.
E' la variazione del campo magnetico, non della radiazione, che può giustificare i cambiamenti climatici con una influenza sulla nuvolosità, sia per i raggi cosmici, sia per gli uv che per la variazione sulla circolazione atmosferica
P S: Ho letto questo adesso scritto da Steph
"E una sintesi delle ricostruzioni di Svalgaard."
a figura 17 c'è il grafico della ricostruzione della TSI adesso me lo leggo
Ultima modifica di clayco; 19/12/2008 alle 14:24
Vi ringrazio leggerò tutto con calma
@ Steph forse hai frainteso Jaworosky quando dici:
"FRra quest'ultime, per es. il fatto che nel 1997/98 si sia verificata l'eruzione del Pinatubo, in realtà datata giugno 1991."
cito il polacco: "During the past 20 years, El Niño has occurred several times, but in 1997-1998, it developed without simultaneous volcanic eruption, Twice earlier, El Niño was associated with large volcanic eruptions, which injected enormous amounts of dust into the stratosphere: El Chichon in 1982, and Mt. Pinatubo in 1991"
 Permessi di Scrittura


 Rispondi Citando


Segnalibri