
-
Comitato Tecnico Scientifico

 Re: CNR: ma è uno scherzo vero ?
Con in mano il dato definitivo, riassumo la situazione spaziale delle stazioni storiche ISAC-CNR e quelle definite come NOAA e poi le due anomalie ottenute da ISAC e NOAA
Analisi temp ESTATE 2014 NOAA vs CNR.png
utilizzando il metodo di grid mesh che riporto
"The grid has one degree resolution, both in latitude and in longitude, and was realised with an interpolation technique based on a radial weight and an angular term.
The radial term was realised with a gaussian weighting function with the following form:
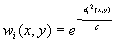
with

where i runs along the stations and  is the distance between the station i and the grid point (x,y). With this choice of the cparameter, we have weights of 0.5 for station distances equal to
  from the grid point we want to calculate.
 is defined as the mean distance of one grid point from its next one obtained by increasing both longitude and latitude by one grid step (it is a sort of mean length of the grid mesh diagonal).
For a grid resolution of 1 deg (as in this case) the parameter is about 130 km.
The angular term accounts for the geographical separation among the sites with available time series. It has the following form:

where  is the angular separation of stations i and l with the vertex of the angle defined at grid point (x,y).
The final weight is the product of the radial and the angular terms.
Each grid point was calculated under one of the following conditions: i) a minimum of two stations at a distance lower than , or ii) a minimum of one station at a distance lower than . The grid value computation (once the above conditions were satisfied) was then performed by considering all stations within a distance of 2 .
In order to avoid biases due to the different lengths of the station records, for temperature we calculated the grid values starting from the anomalies, whereas for precipitation we started from the relative deviations from the means. The conversion of these anomalies (relative deviations) into absolute values requires the knowledge of the monthly normals at the grid point.
Available grid boxes are indicated in the two figures, both for temperature and precipitation, together with the stations involved in the grid computation.
The national mean seires were obtained by averaging all grid boxes over the italian territory and not the station anomalies.
The reason is as follows:
The availability of station data is typically not sufficient to ensure an even distribution of stations throughout a network. But by averaging station anomalies within regions of similar size (grid boxes) and then calculating the average of all the grid box averages, a more representative region-wide anomaly can be calculated.
This makes grid box averaging superior to simply taking the average of all stations in the domain. A network of 1000 stations could theoretically have 700 stations in the northern half of the domain and 300 stations in the southern half. A simple average of the stations could easily create a bias in the domain-wide average to those stations in the north"
Questo risponde all'obiettivo di dare un valore nazionale da riportare nella serie storica 1880-2014 per confronto, tenendo ben presenti tutte le accortezze del caso, per esempio che le stazioni NOAA non erano presenti all'inizio della serie.
E' innegabile invece la discrepanza tra le due mappe di anomalia ISAC e NOAA rispetto alla media 1971-2000 ma per correttezza essa avviene limitatamente tra il Po e la Piana di Lamezia Terme. All'interno di questa grande porzione di territorio italiano, che corrisponde credo ad oltre 2/3, c'è una discrepanza valutabile in un mezzo grado di differenza in più da parte del CNR, con massimo su 3 aree, quella del nord Emilia Romagna, una tra Campania e Basilicata ed una su una porzione del Lazio/Umbria.
Per indagare meglio sull'origine di questa discrepanza, fermo restando che i dati sono ottenuti con uno stesso metodo di omogenizzazione dello stesso dato, ci possiamo concentrare in una regione con confini Bari, Olbia, Grosseto e Pescara dove c'è una quasi totalità di stazioni NOAA ma i dati differiscono di circa mezzo grado ed oltre vista la presenza di quella bolla laziale di oltre 1°.
Considerato che ci sono solo 3 stazioni ISAC (Roma, Foggia e L'Aquila), è difficile comprendere questo scostamento a meno di pensare a dati puntuali estremi di 7 stazioni storiche ISAC collocate nella griglia di riferimento per rovesciare il peso di una ventina di stazioni NOAA sempre nella stessa griglia 
Per quanto riguarda invece la prima area (nord ER) lo smoothing ottenuto su poche stazioni NOAA lo rende meno affidabile rispetto a quello del CNR, per cui solo la riviera dovrebbe essere andata vicino ad un eclatante -1°

 Permessi di Scrittura
- Tu non puoi inviare nuove discussioni
- Tu non puoi inviare risposte
- Tu non puoi inviare allegati
- Tu non puoi modificare i tuoi messaggi
-
Regole del Forum


 Rispondi Citando


Segnalibri