

Era esattamente questo che volevo sapere. Nel grafico risulta un limite delle nevi pari a 2750 per gli ultimi secoli e un delta T di -0,7 rispetto ad oggi. Non ho capito bene cosa sia l'oggi (il 1961-90?) ma sembrerebbe riferirisi ad una temperatura di metà '800. Quindi con una temperatura da PEG, come tu confermi, il limite delle nevi era 2750.Originariamente Scritto da Enrico_3bmeteo

Oggi (nel senso di quest'anno) fa più caldo, rispetto alla PEG di 0,6 - 0,7. Quindi il limite dovrebbe essere più elevato e tu, infatti, lo poni oltre i 3000 mt. Domanda, a questo punto: com'è che nel periodo caldo da 4 a 10.000 anni fa si aveva una temperatura di +0,9 rispetto all'oggi (cioè, in buona sostanza di +1,6 rispetto alla PEG) e il limite nevi era "solo" 2.900? (Anche se c'è un maggiore di, a dir il vero).
E infine una domanda generale, a te o al Ricky. Il limite delle nevi viene calcolato con l'osservazione o ponendolo in relazione con una media dello zero termico? E se sì, qual è questa relazione?
Maurizio
Rome, Italy
41:53:22N, 12:29:53E
............................................................ ................................
.
............................................................ ..............................................
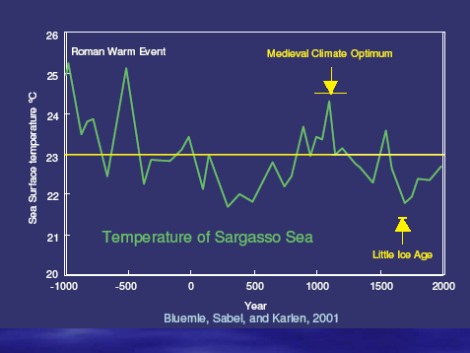
è sul grafico

..
Cold Air Cave, Makapansgat Valley, South Africa
Reference
Holmgren, K., Tyson, P.D., Moberg, A. and Svanered, O. 2001. A preliminary 3000-year regional temperature reconstruction for South Africa. South African Journal of Science 97: 49-51.
Description
Maximum annual air temperatures in the vicinity of Cold Air Cave (24°1'S, 29°11'E) in the Makapansgat Valley of South Africa were inferred from a relationship between color variations in banded growth-layer laminations of a well-dated stalagmite and the air temperature of a surrounding 49-station climatological network developed over the period 1981-1995, as well as a quasi-decadal-resolution record of oxygen and carbon stable isotopes (MWP: AD 800-1100): Peak warmth of the Medieval Warm Period was as much as 2.5°C warmer than the Current Warm Period (AD 1961-1990 mean).

Intorno ai 1550-1600m
Il ghiacciaio di C.Imperatore è stato uno dei più grandi dell'Appennino ma certamente non quello che si è spinto più in basso. Quello di C.Pericoli/Maone/Rio Arno è sceso fin sotto i 1000 metri durante il Riss, mentre sugli Ernici alcuni ghiacciai sono arrivati anche a soli 700m..
Per quanto riguarda il limite superiore delle foreste nel wurmiano sulle Alpi non lo so con precisione, ma non penso che riuscissero a salire oltre i 500m, visto che la calotta influiva negativamente sul clima locale. Sull'Appennino centrale il bosco non saliva mediamente oltre gli 800m; 1000m circa in meno del limite delle nevi

.
Cold Air Cave, Makapansgat Valley of South Africa
Reference
Tyson, P.D., Karlen, W., Holmgren, K. and Heiss, G.A. 2000. The Little Ice Age and medieval warming in South Africa. South African Journal of Science 96: 121-126.
Description
Maximum annual air temperatures in the vicinity of Cold Air Cave (24°1'S, 29°11'E) in the Makapansgat Valley of South Africa were inferred from a relationship between color variations in banded growth-layer laminations of a well-dated stalagmite and the air temperature of a surrounding 49-station climatological network developed over the period 1981-1995, as well as from a quasi-decadal-resolution record of oxygen and carbon stable isotopes. The Medieval Warm Period (AD 1000-1325) was as much as 3-4°C warmer than the Current Warm Period (AD 1961-1990 mean).

beh, questo è interessante..
Crescent Island Crater Lake, Kenya
Reference
Lamb, H., Darbyshire, I. and Verschuren, D. 2003. Vegetation response to rainfall variation and human impact in central Kenya during the past 1100 years. The Holocene 13: 285-292.
Description
The authors present high-resolution pollen data from an 1100-year sediment core taken from Crescent Island Crater Lake (0.75°S, 36.37°E), a subbasin of Lake Naivasha, in the central Rift Valley of Kenya, which served as a proxy record of changes in the balance between regional precipitation and evaporation.
The Medieval Warm Period (~ AD 900-1200) was identified as a prolonged period of drought in which the surrounding forest contracted and the lake level dropped.
Furthermore, from the authors' Figure 3 it can be seen that the MWP drought was of greater magnitude and duration than recent 20th century drought.
 Permessi di Scrittura


 Rispondi Citando


Segnalibri