Nella scala VEI quant'è il Vesuvio??
Ricorderò con piacere i giorni 19/20/21 Dicembre 2009
Pare comunque che durante l'Eruzione di ercolano e Pompei la colonna possa aver raggiunto di 32 km
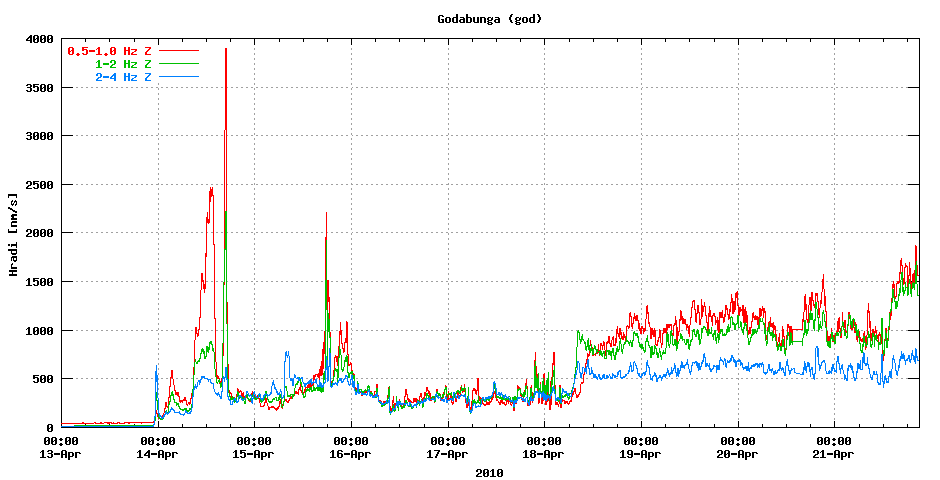
I've asked to me the same thing about time n the answer I gave me is that the tremor shown in that graph is a continuous series of very small accelerations...so u have constant acceleretion but very very small. Moreover in that graph r shown only positive acceleration's peaks (above time axis), for example the red line is probably a line connecting all maximum aceleration's peaks of red frequency, so it isn't the real accelerogram 'cos if it were the red line should go continuously above n below time axis in a very short time space (as an earthquake has both positive and negative accelerations) so you'd see red all the area above the red line ...maybe ...that's my reading, I know well accelerograms but that's the first time I see tremor graphs.
A clarification: these above are not acelerations but velocities (nm/s) but it's the same!!

Ultima modifica di Michele Boncristiano; 21/04/2010 alle 22:02
I am not an expert for volcanos or seismology, so I was based on my physics knowledge. It seems that your explanation is good. For me those tremors looks like very rapid accelerations acting like micro vibrations I believe. And so they have several frequencyes to measure the power of them.
But really, I dont know lot about these things, so I hardly judge the graphs... but I like them
Marko Korosec, Slovenia
Severe Weather Europe - http://www.severe-weather.EU
www.Weather-Photos.NET | http://www.facebook.com/WeatherPhotos.NET
Segnalibri